- Python Pandas Tutorial
- Python Pandas - Home
- Python Pandas - Introduction
- Python Pandas - Environment Setup
- Introduction to Data Structures
- Python Pandas - Series
- Python Pandas - DataFrame
- Python Pandas - Panel
- Python Pandas - Basic Functionality
- Descriptive Statistics
- Function Application
- Python Pandas - Reindexing
- Python Pandas - Iteration
- Python Pandas - Sorting
- Working with Text Data
- Options & Customization
- Indexing & Selecting Data
- Statistical Functions
- Python Pandas - Window Functions
- Python Pandas - Aggregations
- Python Pandas - Missing Data
- Python Pandas - GroupBy
- Python Pandas - Merging/Joining
- Python Pandas - Concatenation
- Python Pandas - Date Functionality
- Python Pandas - Timedelta
- Python Pandas - Categorical Data
- Python Pandas - Visualization
- Python Pandas - IO Tools
- Python Pandas - Sparse Data
- Python Pandas - Caveats & Gotchas
- Comparison with SQL
- Python Pandas Useful Resources
- Python Pandas - Quick Guide
- Python Pandas - Useful Resources
- Python Pandas - Discussion
Python Pandas - Visualization
Basic Plotting: plot
This functionality on Series and DataFrame is just a simple wrapper around the matplotlib libraries plot() method.
import pandas as pd
import numpy as np

df = pd.DataFrame(np.random.randn(10,4),index=pd.date_range('1/1/2000',
   periods=10), columns=list('ABCD'))

df.plot()
Its output is as follows −
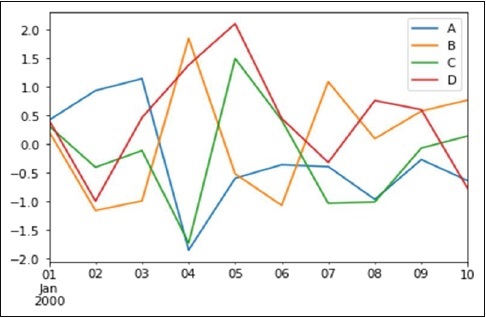
If the index consists of dates, it calls gct().autofmt_xdate() to format the x-axis as shown in the above illustration.
We can plot one column versus another using the x and y keywords.
Plotting methods allow a handful of plot styles other than the default line plot. These methods can be provided as the kind keyword argument to plot(). These include −
- bar or barh for bar plots
- hist for histogram
- box for boxplot
- 'area' for area plots
- 'scatter' for scatter plots
Bar Plot
Let us now see what a Bar Plot is by creating one. A bar plot can be created in the following way −
import pandas as pd
import numpy as np

df = pd.DataFrame(np.random.rand(10,4),columns=['a','b','c','d')
df.plot.bar()
Its output is as follows −
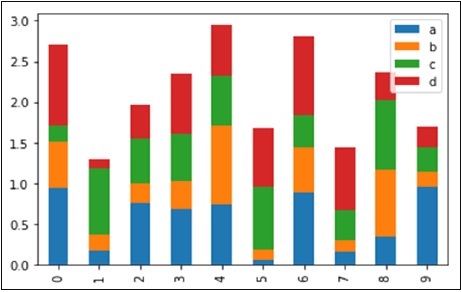
To produce a stacked bar plot, pass stacked=True −
import pandas as pd
df = pd.DataFrame(np.random.rand(10,4),columns=['a','b','c','d')
df.plot.bar(stacked=True)
Its output is as follows −

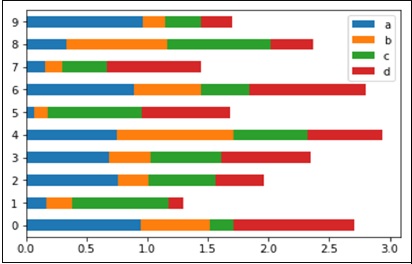
To get horizontal bar plots, use the barh method −
import pandas as pd
import numpy as np

df = pd.DataFrame(np.random.rand(10,4),columns=['a','b','c','d')

df.plot.barh(stacked=True)
Its output is as follows −
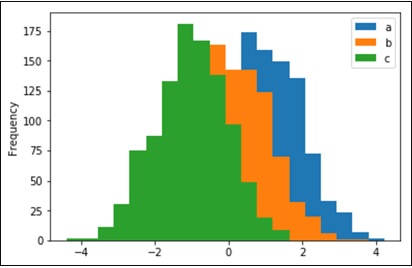
Histograms
Histograms can be plotted using the plot.hist() method. We can specify number of bins.
import pandas as pd
import numpy as np

df = pd.DataFrame({'a':np.random.randn(1000)+1,'b':np.random.randn(1000),'c':
np.random.randn(1000) - 1}, columns=['a', 'b', 'c'])

df.plot.hist(bins=20)
Its output is as follows −
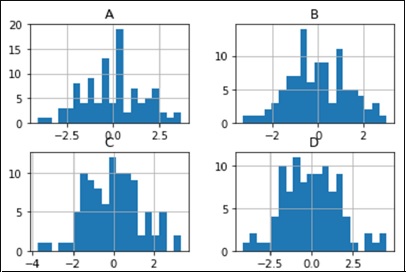
To plot different histograms for each column, use the following code −
import pandas as pd
import numpy as np

df=pd.DataFrame({'a':np.random.randn(1000)+1,'b':np.random.randn(1000),'c':
np.random.randn(1000) - 1}, columns=['a', 'b', 'c'])

df.diff.hist(bins=20)
Its output is as follows −
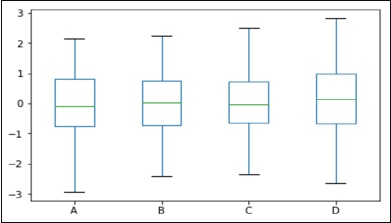
Box Plots
Boxplot can be drawn calling Series.box.plot() and DataFrame.box.plot(), or DataFrame.boxplot() to visualize the distribution of values within each column.
For instance, here is a boxplot representing five trials of 10 observations of a uniform random variable on [0,1).
import pandas as pd
import numpy as np
df = pd.DataFrame(np.random.rand(10, 5), columns=['A', 'B', 'C', 'D', 'E'])
df.plot.box()
Its output is as follows −
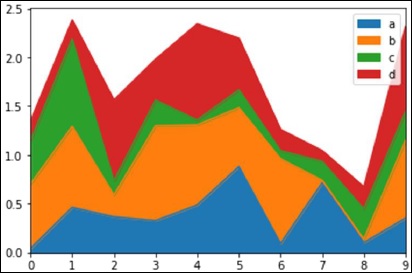
Area Plot
Area plot can be created using the Series.plot.area() or the DataFrame.plot.area() methods.
import pandas as pd
import numpy as np

df = pd.DataFrame(np.random.rand(10, 4), columns=['a', 'b', 'c', 'd'])
df.plot.area()
Its output is as follows −
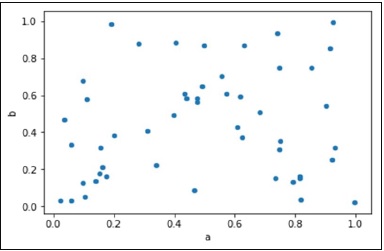
Scatter Plot
Scatter plot can be created using the DataFrame.plot.scatter() methods.
import pandas as pd
import numpy as np
df = pd.DataFrame(np.random.rand(50, 4), columns=['a', 'b', 'c', 'd'])
df.plot.scatter(x='a', y='b')
Its output is as follows −
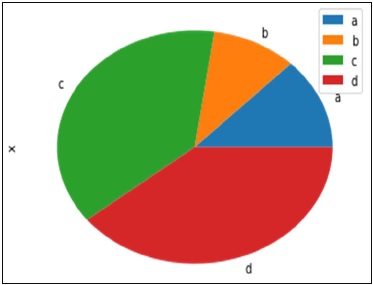
Pie Chart
Pie chart can be created using the DataFrame.plot.pie() method.
import pandas as pd
import numpy as np

df = pd.DataFrame(3 * np.random.rand(4), index=['a', 'b', 'c', 'd'], columns=['x'])
df.plot.pie(subplots=True)
Its output is as follows −