- Matplotlib Basics
- Matplotlib - Home
- Matplotlib - Introduction
- Matplotlib - Vs Seaborn
- Matplotlib - Environment Setup
- Matplotlib - Anaconda distribution
- Matplotlib - Jupyter Notebook
- Matplotlib - Pyplot API
- Matplotlib - Simple Plot
- Matplotlib - Saving Figures
- Matplotlib - Markers
- Matplotlib - Figures
- Matplotlib - Styles
- Matplotlib - Legends
- Matplotlib - Colors
- Matplotlib - Colormaps
- Matplotlib - Colormap Normalization
- Matplotlib - Choosing Colormaps
- Matplotlib - Colorbars
- Matplotlib - Text
- Matplotlib - Text properties
- Matplotlib - Subplot Titles
- Matplotlib - Images
- Matplotlib - Image Masking
- Matplotlib - Annotations
- Matplotlib - Arrows
- Matplotlib - Fonts
- Matplotlib - What are Fonts?
- Setting Font Properties Globally
- Matplotlib - Font Indexing
- Matplotlib - Font Properties
- Matplotlib - Scales
- Matplotlib - Linear and Logarthmic Scales
- Matplotlib - Symmetrical Logarithmic and Logit Scales
- Matplotlib - LaTeX
- Matplotlib - What is LaTeX?
- Matplotlib - LaTeX for Mathematical Expressions
- Matplotlib - LaTeX Text Formatting in Annotations
- Matplotlib - PostScript
- Enabling LaTex Rendering in Annotations
- Matplotlib - Mathematical Expressions
- Matplotlib - Animations
- Matplotlib - Artists
- Matplotlib - Styling with Cycler
- Matplotlib - Paths
- Matplotlib - Path Effects
- Matplotlib - Transforms
- Matplotlib - Ticks and Tick Labels
- Matplotlib - Radian Ticks
- Matplotlib - Dateticks
- Matplotlib - Tick Formatters
- Matplotlib - Tick Locators
- Matplotlib - Basic Units
- Matplotlib - Autoscaling
- Matplotlib - Reverse Axes
- Matplotlib - Logarithmic Axes
- Matplotlib - Symlog
- Matplotlib - Unit Handling
- Matplotlib - Ellipse with Units
- Matplotlib - Spines
- Matplotlib - Axis Ranges
- Matplotlib - Axis Scales
- Matplotlib - Axis Ticks
- Matplotlib - Formatting Axes
- Matplotlib - Axes Class
- Matplotlib - Twin Axes
- Matplotlib - Figure Class
- Matplotlib - Multiplots
- Matplotlib - Grids
- Matplotlib - Object-oriented Interface
- Matplotlib - PyLab module
- Matplotlib - Subplots() Function
- Matplotlib - Subplot2grid() Function
- Matplotlib - Anchored Artists
- Matplotlib - Manual Contour
- Matplotlib - Coords Report
- Matplotlib - AGG filter
- Matplotlib - Ribbon Box
- Matplotlib - Fill Spiral
- Matplotlib - Findobj Demo
- Matplotlib - Hyperlinks
- Matplotlib - Image Thumbnail
- Matplotlib - Plotting with Keywords
- Matplotlib - Create Logo
- Matplotlib - Multipage PDF
- Matplotlib - Multiprocessing
- Matplotlib - Print Stdout
- Matplotlib - Compound Path
- Matplotlib - Sankey Class
- Matplotlib - MRI with EEG
- Matplotlib - Stylesheets
- Matplotlib - Background Colors
- Matplotlib - Basemap
- Matplotlib Event Handling
- Matplotlib - Event Handling
- Matplotlib - Close Event
- Matplotlib - Mouse Move
- Matplotlib - Click Events
- Matplotlib - Scroll Event
- Matplotlib - Keypress Event
- Matplotlib - Pick Event
- Matplotlib - Looking Glass
- Matplotlib - Path Editor
- Matplotlib - Poly Editor
- Matplotlib - Timers
- Matplotlib - Viewlims
- Matplotlib - Zoom Window
- Matplotlib Plotting
- Matplotlib - Bar Graphs
- Matplotlib - Histogram
- Matplotlib - Pie Chart
- Matplotlib - Scatter Plot
- Matplotlib - Box Plot
- Matplotlib - Violin Plot
- Matplotlib - Contour Plot
- Matplotlib - 3D Plotting
- Matplotlib - 3D Contours
- Matplotlib - 3D Wireframe Plot
- Matplotlib - 3D Surface Plot
- Matplotlib - Quiver Plot
- Matplotlib Useful Resources
- Matplotlib - Quick Guide
- Matplotlib - Useful Resources
- Matplotlib - Discussion
Matplotlib - Text properties
Text properties in Matplotlib refer to a set of attributes that can be configured to control the appearance and layout of text elements within a plot. These properties include various characteristics such as −
- font style
- color
- size
- alignment, and more.
By manipulating these properties, you can customize the visual aspects of text within the plots.
Controlling text properties and layout in Matplotlib involves configuring various attributes of the matplotlib.text.Text instances. These properties can be adjusted through keyword arguments in functions like set_title, set_xlabel, and text.
Below, we explore key text properties in Matplotlib along with examples.
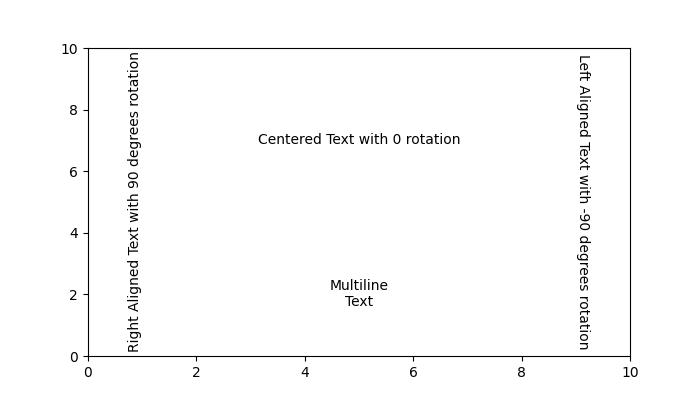
Text layout and positioning properties
Text layout and positioning are crucial aspects for placing and aligning text elements within a plot. Following are the list of properties and their details.
Position − Specifies the coordinates (x, y) where the text is placed.
Rotation − Defines the angle of rotation for the text. Options include degrees, 'vertical', or 'horizontal'.
Horizontal Alignment (ha) − Determines the alignment of the text along the x-axis. Options include 'center', 'right', and 'left'.
Vertical Alignment (va) − Controls the alignment of the text along the y-axis. Options include 'center', 'top', 'bottom', and 'baseline'.
Multialignment − For newline-separated strings, this property controls left, center, or right justification for different lines.
Example
This example demonstrates the application of various layout and positioning properties.
import matplotlib.pyplot as plt

# Create a figure
fig, ax = plt.subplots(figsize=(7, 4))

# Set the axis limits
plt.axis((0, 10, 0, 10))

# Add text with various layout and positioning properties
ax.text(5, 7, 'Centered Text with 0 rotation', horizontalalignment='center', verticalalignment='center', rotation=0)
ax.text(1, 5, 'Right Aligned Text with 90 degrees rotation', ha='right', va='center', rotation=90)
ax.text(9, 5, 'Left Aligned Text with -90 degrees rotation', ha='left', va='center', rotation=-90)
ax.text(5, 2, 'Multiline\nText', ha='center', va='center', multialignment='center')

# Display the plot
plt.show()
print('Text is added successfully with the various layout and positioning properties..')
Output
On executing the above code we will get the following output −

Text is added successfully with the various layout and positioning properties..
Text color and transparency properties
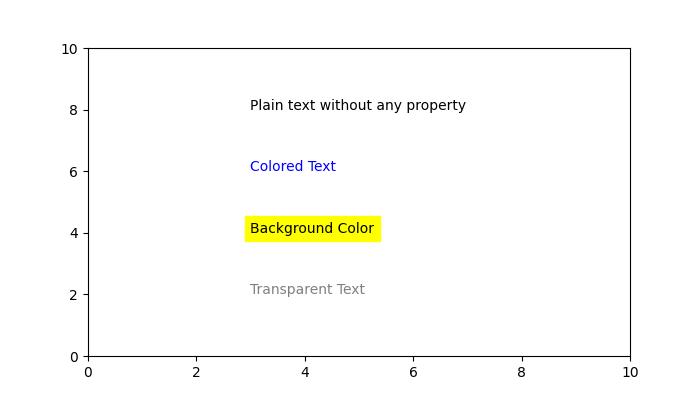
Color and transparency properties enhance the visual appearance of text elements within a plot.
color − Specifies the color of the text. This can be any valid matplotlib color.
backgroundcolor − Defines the background color behind the text. It can be set using any valid matplotlib color.
alpha − Represents the transparency of the text. It is specified as a float, where 0.0 is fully transparent, and 1.0 is fully opaque.
Example
This example demonstrates how to use color and transparency properties in Matplotlib.
import matplotlib.pyplot as plt

# Create a figure
fig, ax = plt.subplots(figsize=(7, 4))

# Set the axis limits
plt.axis((0, 10, 0, 10))

# Add text with color and transparency properties
ax.text(3, 8, 'Plain text without any property')
ax.text(3, 6, 'Colored Text', color='blue')
ax.text(3, 4, 'Background Color', backgroundcolor='yellow')
ax.text(3, 2, 'Transparent Text', alpha=0.5)

# Display the plot
plt.show()
print('Text added successfully...')
Output
On executing the above code we will get the following output −

Text added successfully...
Different font properties
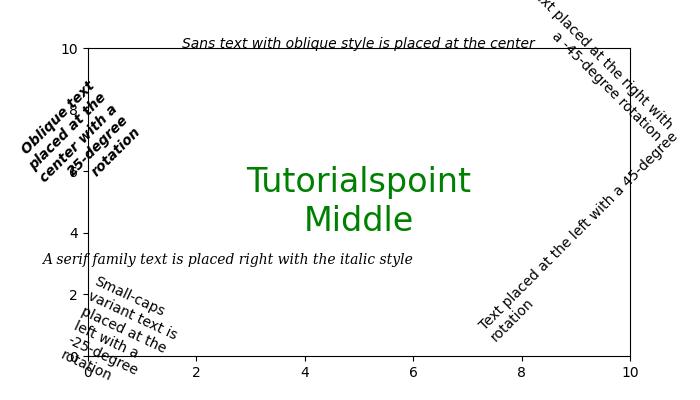
Font properties are essential for customizing the appearance of text elements within a plot. These properties provide control over the type, style, thickness, size, variant, and name of the font used for rendering text.
Family − Specifies the type of font to be used, such as 'serif', 'sans-serif', or 'monospace'.
Style or Fontstyle − Determines the style of the font, with options like 'normal', 'italic', or 'oblique'.
Weight or Fontweight − The thickness or boldness of the font. Options include 'normal', 'bold', 'heavy', 'light', 'ultrabold', and 'ultralight'.
Size or Fontsize − Specifies the size of the font in points or relative sizes like 'smaller' or 'x-large'.
Name or Fontname − Defines the name of the font as a string. Examples include 'Sans', 'Courier', 'Helvetica', and more.
Variant − Describes the font variant, with options like 'normal' or 'small-caps'.
Example
This example demonstrates how to use various font properties to customize the appearance of text in Matplotlib.
import matplotlib.pyplot as plt

# Create a figure
fig = plt.figure(figsize=(7, 4))

# Set the axis limits
plt.axis((0, 10, 0, 10))

# Define a long string
sample_text = ("Tutorialspoint")

# Add text at various locations with various configurations
plt.text(0, 9, 'Oblique text placed at the center with a 25-degree rotation',
   fontstyle='oblique', fontweight='heavy', ha='center', va='baseline', rotation=45, wrap=True)
plt.text(7.5, 0.5, 'Text placed at the left with a 45-degree rotation', ha='left', rotation=45, wrap=True)
plt.text(5, 5, sample_text + '\nMiddle', ha='center', va='center', color='green', fontsize=24)
plt.text(10.5, 7, 'Text placed at the right with a -45-degree rotation', ha='right', rotation=-45, wrap=True)
plt.text(5, 10, 'Sans text with oblique style is placed at the center', fontsize=10, fontname='Sans',
   style='oblique', ha='center', va='baseline', wrap=True)
plt.text(6, 3, 'A serif family text is placed right with the italic style', family='serif',
   style='italic', ha='right', wrap=True)
plt.text(-0.5, 0, 'Small-caps variant text is placed at the left with a -25-degree rotation',
   variant='small-caps', ha='left', rotation=-25, wrap=True)

# Display the plot
plt.show()
print('Text added successfully...')
Output
On executing the above code we will get the following output −

Text added successfully...
The bounding box and Clipping Properties
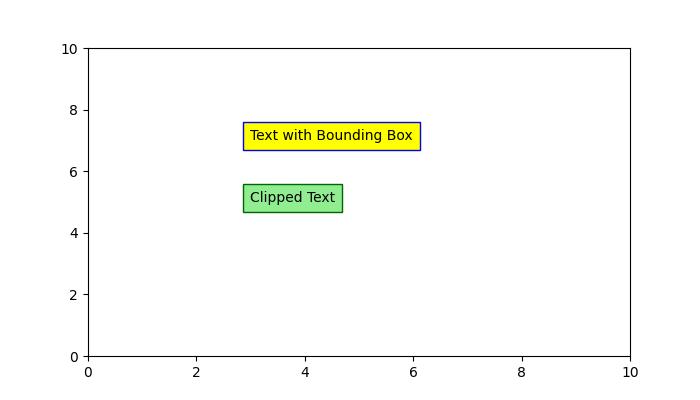
Bounding box and Clipping properties are used to control the layout and visibility of text elements within a plot. These properties include specifying a bounding box for text, defining clipping parameters, and enabling or disabling clipping.
Bbox − Defines a bounding box for the text. It includes properties like color, padding, and more.
Clip Box and Clip Path − Specify a bounding box or path for clipping the text. These properties allow you to control the region where the text is visible.
Clip On − A boolean indicating whether clipping is enabled. When set to True, the text is clipped to the specified region.
Example
This example demonstrates the use of a bounding box and clipping properties while adding text to a plot.
import matplotlib.pyplot as plt

# Create a figure
fig = plt.figure(figsize=(7, 4))

# Set the axis limits
plt.axis((0, 10, 0, 10))

# Add text with bounding box and clipping properties
plt.text(3, 7, 'Text with Bounding Box', bbox={'facecolor': 'yellow', 'edgecolor': 'blue', 'pad': 5})
plt.text(3, 5, 'Clipped Text', bbox={'facecolor': 'lightgreen', 'edgecolor': 'darkgreen', 'pad': 5}, clip_on=True)

# Display the plot
plt.show()
print('Text added successfully...')
Output
On executing the above code we will get the following output −

Text added successfully...
Other Properties
Also matplotlib provides other properties like Label, Linespacing, picker, and more.