- Matplotlib Basics
- Matplotlib - Home
- Matplotlib - Introduction
- Matplotlib - Vs Seaborn
- Matplotlib - Environment Setup
- Matplotlib - Anaconda distribution
- Matplotlib - Jupyter Notebook
- Matplotlib - Pyplot API
- Matplotlib - Simple Plot
- Matplotlib - Saving Figures
- Matplotlib - Markers
- Matplotlib - Figures
- Matplotlib - Styles
- Matplotlib - Legends
- Matplotlib - Colors
- Matplotlib - Colormaps
- Matplotlib - Colormap Normalization
- Matplotlib - Choosing Colormaps
- Matplotlib - Colorbars
- Matplotlib - Text
- Matplotlib - Text properties
- Matplotlib - Subplot Titles
- Matplotlib - Images
- Matplotlib - Image Masking
- Matplotlib - Annotations
- Matplotlib - Arrows
- Matplotlib - Fonts
- Matplotlib - What are Fonts?
- Setting Font Properties Globally
- Matplotlib - Font Indexing
- Matplotlib - Font Properties
- Matplotlib - Scales
- Matplotlib - Linear and Logarthmic Scales
- Matplotlib - Symmetrical Logarithmic and Logit Scales
- Matplotlib - LaTeX
- Matplotlib - What is LaTeX?
- Matplotlib - LaTeX for Mathematical Expressions
- Matplotlib - LaTeX Text Formatting in Annotations
- Matplotlib - PostScript
- Enabling LaTex Rendering in Annotations
- Matplotlib - Mathematical Expressions
- Matplotlib - Animations
- Matplotlib - Artists
- Matplotlib - Styling with Cycler
- Matplotlib - Paths
- Matplotlib - Path Effects
- Matplotlib - Transforms
- Matplotlib - Ticks and Tick Labels
- Matplotlib - Radian Ticks
- Matplotlib - Dateticks
- Matplotlib - Tick Formatters
- Matplotlib - Tick Locators
- Matplotlib - Basic Units
- Matplotlib - Autoscaling
- Matplotlib - Reverse Axes
- Matplotlib - Logarithmic Axes
- Matplotlib - Symlog
- Matplotlib - Unit Handling
- Matplotlib - Ellipse with Units
- Matplotlib - Spines
- Matplotlib - Axis Ranges
- Matplotlib - Axis Scales
- Matplotlib - Axis Ticks
- Matplotlib - Formatting Axes
- Matplotlib - Axes Class
- Matplotlib - Twin Axes
- Matplotlib - Figure Class
- Matplotlib - Multiplots
- Matplotlib - Grids
- Matplotlib - Object-oriented Interface
- Matplotlib - PyLab module
- Matplotlib - Subplots() Function
- Matplotlib - Subplot2grid() Function
- Matplotlib - Anchored Artists
- Matplotlib - Manual Contour
- Matplotlib - Coords Report
- Matplotlib - AGG filter
- Matplotlib - Ribbon Box
- Matplotlib - Fill Spiral
- Matplotlib - Findobj Demo
- Matplotlib - Hyperlinks
- Matplotlib - Image Thumbnail
- Matplotlib - Plotting with Keywords
- Matplotlib - Create Logo
- Matplotlib - Multipage PDF
- Matplotlib - Multiprocessing
- Matplotlib - Print Stdout
- Matplotlib - Compound Path
- Matplotlib - Sankey Class
- Matplotlib - MRI with EEG
- Matplotlib - Stylesheets
- Matplotlib - Background Colors
- Matplotlib - Basemap
- Matplotlib Event Handling
- Matplotlib - Event Handling
- Matplotlib - Close Event
- Matplotlib - Mouse Move
- Matplotlib - Click Events
- Matplotlib - Scroll Event
- Matplotlib - Keypress Event
- Matplotlib - Pick Event
- Matplotlib - Looking Glass
- Matplotlib - Path Editor
- Matplotlib - Poly Editor
- Matplotlib - Timers
- Matplotlib - Viewlims
- Matplotlib - Zoom Window
- Matplotlib Plotting
- Matplotlib - Bar Graphs
- Matplotlib - Histogram
- Matplotlib - Pie Chart
- Matplotlib - Scatter Plot
- Matplotlib - Box Plot
- Matplotlib - Violin Plot
- Matplotlib - Contour Plot
- Matplotlib - 3D Plotting
- Matplotlib - 3D Contours
- Matplotlib - 3D Wireframe Plot
- Matplotlib - 3D Surface Plot
- Matplotlib - Quiver Plot
- Matplotlib Useful Resources
- Matplotlib - Quick Guide
- Matplotlib - Useful Resources
- Matplotlib - Discussion
Matplotlib - Create Logo
Creating a logo generally means designing a unique symbol or image that represents a brand, company, product, or organization. It involves combining visual elements like shapes, colors, and text to convey the identity and message of the entity it represents.
Create Logo in Matplotlib
You can create a logo in Matplotlib using the library's plotting functionalities to design a visual symbol or image that represents a brand, company, product, or organization.
Similar to other plotting tasks, creating a logo in Matplotlib requires combining various graphical elements such as shapes, colors, text, and possibly images to craft a unique and recognizable emblem.
Simple Geometric Logo
A simple geometric logo in Matplotlib refers to creating a basic graphical representation using geometric shapes like squares, circles, triangles, or lines.
You can use functions like plt.plot(), plt.scatter(), plt.fill(), or plt.text() to draw various geometric shapes and add text to your plot. By combining these elements and arranging them creatively, you can design a simple logo for your project, brand, or visualization.
Example
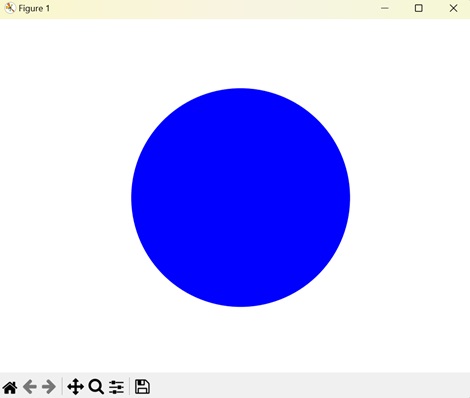
In the following example, we create a simple circular logo using Matplotlib. We use the Circle() function to draw a blue-colored circle and add it to the plot using the add_artist() function. We then turn off the axes, and set the aspect ratio to ensure the circle appears round −
import matplotlib.pyplot as plt

# Creating a circle
circle = plt.Circle((0.5, 0.5), 0.4, color='blue')

# Creating the plot
fig, ax = plt.subplots()
ax.add_artist(circle)

# Customizing the plot
ax.set_aspect('equal')
ax.axis('off')

# Displaying the logo
plt.show()
Output
Following is the output of the above code −

Creating a Text Logo
A text logo in Matplotlib involves creating a logo or visual representation using text elements. Instead of relying on geometric shapes or images, a text logo uses characters and symbols to convey a brand or identity.
In Matplotlib, you can use the plt.text() function to add text to your plot. This function allows you to specify the position, text content, font size, color, and other properties of the text you want to display.
Example
In here, we create a text-based logo using Matplotlib. We use the text() function to place the word "Logo" at the center of the plot with "red" color and customized font size −
import matplotlib.pyplot as plt

# Creating text
text = plt.text(0.5, 0.5, 'Logo', fontsize=50, color='red', ha='center', va='center')

# Customizing the plot
plt.axis('off')

# Displaying the logo
plt.show()
Output
On executing the above code we will get the following output −

Creating a Complex Shape Logo
A complex shape logo in Matplotlib refers to creating a logo using intricate or detailed shapes, patterns, and designs. Unlike simple geometric logos, which rely on basic shapes like squares, circles, or triangles, complex shape logos often involve more elaborate and intricate elements.
In Matplotlib, you can combine various plotting functions, such as plt.plot(), plt.fill(), plt.scatter(), and plt.polygon(), to create complex shapes and patterns. By carefully arranging these elements and applying different colors, styles, and transformations, you can design intricate logos that convey a unique brand identity or message.
Complex shape logos can include a wide range of elements, such as curves, curves, arcs, polygons, and other geometric shapes. They may also consist of text, images, or other visual elements.
Example
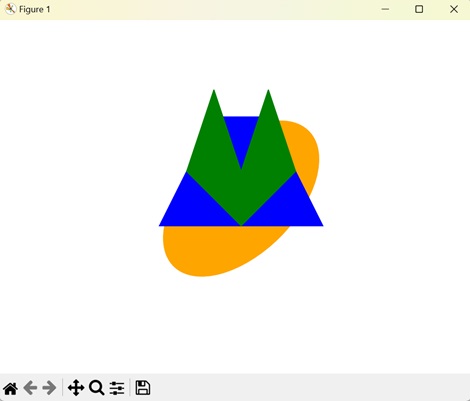
Now, we create a logo with a complex shape by combining an ellipse, a polygon, and a star. We create each shape the Ellipse and Polygon classes, respectively. We then use the add_artist() function to add each shape to the plot −
import matplotlib.pyplot as plt
from matplotlib.patches import Ellipse, Polygon

# Creating an ellipse
ellipse = Ellipse((0.5, 0.5), width=0.7, height=0.4, angle=45, color='orange')

# Creating a polygon
vertices = [[0.2, 0.4], [0.8, 0.4], [0.6, 0.8], [0.4, 0.8]]
polygon = Polygon(vertices, closed=True, color='blue')

# Creating a star
star_vertices = [[0.3, 0.6], [0.4, 0.9], [0.5, 0.6], [0.6, 0.9], [0.7, 0.6],
   [0.5, 0.4], [0.3, 0.6]]
star = Polygon(star_vertices, closed=True, color='green')

# Creating the plot
fig, ax = plt.subplots()
ax.add_artist(ellipse)
ax.add_patch(polygon)
ax.add_patch(star)

# Customizing the plot
ax.set_aspect('equal')
ax.axis('off')

# Displaying the logo
plt.show()
Output
After executing the above code, we get the following output −

Creating an Image Logo
An image logo in Matplotlib refers to using an image or picture as a logo in a plot. Instead of creating shapes, lines, or text to form a logo, you can insert an existing image file, such as a PNG, JPEG, or GIF, into your Matplotlib plot.
To add an image logo to a Matplotlib plot, you can use the plt.imshow() function, which displays an image on the plot. You will first need to load the image file and then pass the image data to plt.imshow() to display it within your plot.
Example
In the following example, we create a logo using an external image file with Matplotlib. We load the image using the imread() function and then display it using the imshow() function −
import matplotlib.pyplot as plt
import matplotlib.image as mpimg

# Loading image
img = mpimg.imread('tutorialspoint_logo.png')

# Displaying image
plt.imshow(img)
plt.axis('off')

# Displaying the logo
plt.show()
Output
On executing the above code we will get the following output −
