- Matplotlib Basics
- Matplotlib - Home
- Matplotlib - Introduction
- Matplotlib - Vs Seaborn
- Matplotlib - Environment Setup
- Matplotlib - Anaconda distribution
- Matplotlib - Jupyter Notebook
- Matplotlib - Pyplot API
- Matplotlib - Simple Plot
- Matplotlib - Saving Figures
- Matplotlib - Markers
- Matplotlib - Figures
- Matplotlib - Styles
- Matplotlib - Legends
- Matplotlib - Colors
- Matplotlib - Colormaps
- Matplotlib - Colormap Normalization
- Matplotlib - Choosing Colormaps
- Matplotlib - Colorbars
- Matplotlib - Text
- Matplotlib - Text properties
- Matplotlib - Subplot Titles
- Matplotlib - Images
- Matplotlib - Image Masking
- Matplotlib - Annotations
- Matplotlib - Arrows
- Matplotlib - Fonts
- Matplotlib - What are Fonts?
- Setting Font Properties Globally
- Matplotlib - Font Indexing
- Matplotlib - Font Properties
- Matplotlib - Scales
- Matplotlib - Linear and Logarthmic Scales
- Matplotlib - Symmetrical Logarithmic and Logit Scales
- Matplotlib - LaTeX
- Matplotlib - What is LaTeX?
- Matplotlib - LaTeX for Mathematical Expressions
- Matplotlib - LaTeX Text Formatting in Annotations
- Matplotlib - PostScript
- Enabling LaTex Rendering in Annotations
- Matplotlib - Mathematical Expressions
- Matplotlib - Animations
- Matplotlib - Artists
- Matplotlib - Styling with Cycler
- Matplotlib - Paths
- Matplotlib - Path Effects
- Matplotlib - Transforms
- Matplotlib - Ticks and Tick Labels
- Matplotlib - Radian Ticks
- Matplotlib - Dateticks
- Matplotlib - Tick Formatters
- Matplotlib - Tick Locators
- Matplotlib - Basic Units
- Matplotlib - Autoscaling
- Matplotlib - Reverse Axes
- Matplotlib - Logarithmic Axes
- Matplotlib - Symlog
- Matplotlib - Unit Handling
- Matplotlib - Ellipse with Units
- Matplotlib - Spines
- Matplotlib - Axis Ranges
- Matplotlib - Axis Scales
- Matplotlib - Axis Ticks
- Matplotlib - Formatting Axes
- Matplotlib - Axes Class
- Matplotlib - Twin Axes
- Matplotlib - Figure Class
- Matplotlib - Multiplots
- Matplotlib - Grids
- Matplotlib - Object-oriented Interface
- Matplotlib - PyLab module
- Matplotlib - Subplots() Function
- Matplotlib - Subplot2grid() Function
- Matplotlib - Anchored Artists
- Matplotlib - Manual Contour
- Matplotlib - Coords Report
- Matplotlib - AGG filter
- Matplotlib - Ribbon Box
- Matplotlib - Fill Spiral
- Matplotlib - Findobj Demo
- Matplotlib - Hyperlinks
- Matplotlib - Image Thumbnail
- Matplotlib - Plotting with Keywords
- Matplotlib - Create Logo
- Matplotlib - Multipage PDF
- Matplotlib - Multiprocessing
- Matplotlib - Print Stdout
- Matplotlib - Compound Path
- Matplotlib - Sankey Class
- Matplotlib - MRI with EEG
- Matplotlib - Stylesheets
- Matplotlib - Background Colors
- Matplotlib - Basemap
- Matplotlib Event Handling
- Matplotlib - Event Handling
- Matplotlib - Close Event
- Matplotlib - Mouse Move
- Matplotlib - Click Events
- Matplotlib - Scroll Event
- Matplotlib - Keypress Event
- Matplotlib - Pick Event
- Matplotlib - Looking Glass
- Matplotlib - Path Editor
- Matplotlib - Poly Editor
- Matplotlib - Timers
- Matplotlib - Viewlims
- Matplotlib - Zoom Window
- Matplotlib Plotting
- Matplotlib - Bar Graphs
- Matplotlib - Histogram
- Matplotlib - Pie Chart
- Matplotlib - Scatter Plot
- Matplotlib - Box Plot
- Matplotlib - Violin Plot
- Matplotlib - Contour Plot
- Matplotlib - 3D Plotting
- Matplotlib - 3D Contours
- Matplotlib - 3D Wireframe Plot
- Matplotlib - 3D Surface Plot
- Matplotlib - Quiver Plot
- Matplotlib Useful Resources
- Matplotlib - Quick Guide
- Matplotlib - Useful Resources
- Matplotlib - Discussion
Matplotlib - Close Event
In the context of programming and software design, an event refers to an action or incident that is identified by the software. These events can be initiated by the system, user inputs, or other sources and are subject to handling by the software.
Specifically, a close event is an occurrence triggered when a figure is closed within the software interface. This event means the termination or closure of the graphical representation or window associated with the figure and reminds the software to respond accordingly.
Close Events in Matplotlib
Matplotlib provides a set of tools to handle events, among them is the ability to handle close events. A close event in Matplotlib occurs when a figure window is closed, triggering specific actions within your Python script. By connecting to the close_event you can execute custom code in response to a figure being closed.
In this tutorial, we will explore how to use close events in Matplotlib to enhance interactive plots.
Example
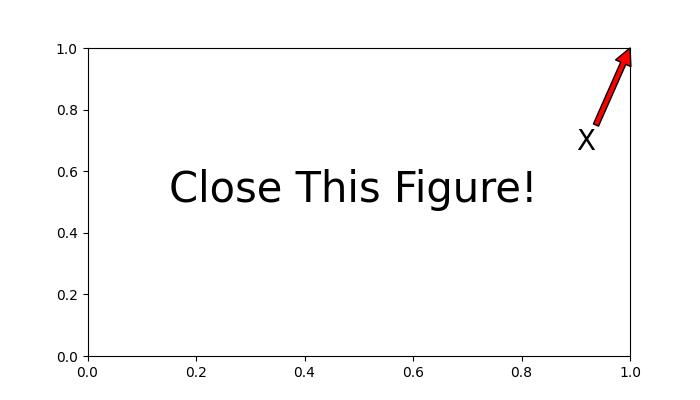
Here is a simple example that displays a message when the user closes the figure.
import matplotlib.pyplot as plt

def on_close(event):
   print('The Figure is Closed!')

fig, ax = plt.subplots(figsize=(7, 4))
ax.annotate('X', xy=(1, 1), xytext=(0.9, 0.65), fontsize=20,
   arrowprops=dict(facecolor='red'),
   horizontalalignment='left',
   verticalalignment='bottom')

fig.canvas.mpl_connect('close_event', on_close)

ax.text(0.15, 0.5, 'Close This Figure!', dict(size=30))
plt.show()
Output
On executing the above code we will get the following output −

After closing the above output figure, the following message is displayed in the console −
The Figure is Closed!
Detecting Closed Axes
When dealing with multiple axes in a figure, you need to determine if a specific axis has been closed you can use the close event action in Matlotlib.
Example
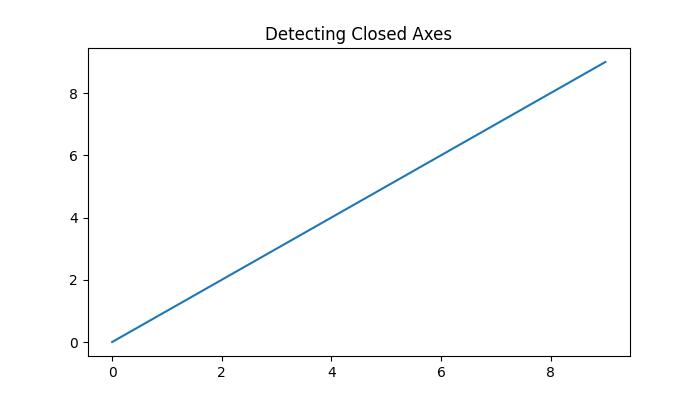
Here is an example that demonstrates how to determine if a specific axis has been closed or not, using the close event in Matplotlib.
import matplotlib.pyplot as plt

# Function to handle the event
def on_close(event):
   event.canvas.figure.axes[0].has_been_closed = True
   print('The Figure is Closed!')

# Create the figure
fig, ax = plt.subplots(figsize=(7, 4))
ax.set_title('Detecting Closed Axes')
ax.has_been_closed = False
ax.plot(range(10))

# connect the event with the callable function
fig.canvas.mpl_connect('close_event', on_close)

plt.show()
print('Check the attribute has_been_closed:', ax.has_been_closed)
Output
On executing the above program you will get the following output −

After closing the above output figure, the following message is displayed in the console −
The Figure is Closed!
Check the attribute has_been_closed: True
Continuing Code After Closing
In some cases, it may be necessary for your code to continue running even after the figure is closed (close event triggered). This is particularly useful for background processes or animations.
Example
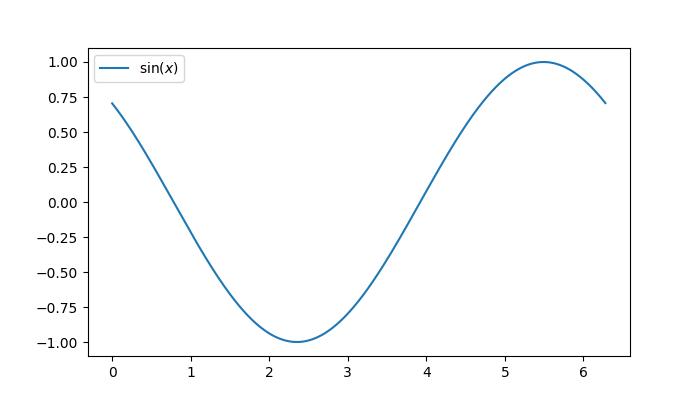
The following example demonstrates how to continue code execution after the figure is closed.
import matplotlib.pyplot as plt
import matplotlib.animation as animation
import numpy as np
import time

close_flag = 0

def handle_close(evt):
   global close_flag
   close_flag = 1
   print('The Figure is Closed!')

# Activate interactive mode
plt.ion()
fig, ax = plt.subplots()

# listen to close event
fig.canvas.mpl_connect('close_event', handle_close)

# Generating x values
x = np.arange(0, 2*np.pi, 0.01)
y = np.sin(x)

# Plotting the initial sine curve
line, = ax.plot(x, y)
ax.legend([r'$\sin(x)$'])

# Function to update the plot for each frame of the animation
def update(frame):
   line.set_ydata(np.sin(x + frame / 50))
   return line

t = 0
delta_t = 0.1
while close_flag == 0:
   if abs(t - round(t)) < 1e-5:
      print(round(t))

   x = x + delta_t
   y = y - delta_t

   # Creating a FuncAnimation object
   ani = animation.FuncAnimation(fig=fig, func=update, frames=40, interval=30)

   # draw the figure
   fig.canvas.draw()
   fig.canvas.flush_events()

   # wait a little bit of time
   time.sleep(delta_t)

   t += delta_t

   if close_flag == 1:
      break

print('ok')
Output
On executing the above program you will get the following output −

After closing the above output figure, the following message is displayed in the console −
0
1
2
3
4
5
The Figure is Closed!
ok
Watch the video below to observe how the close event feature works here.
